Every campaign, measured to the close
A best-practice guide from ImaginAItion Studios, part of your AI Assessment. Use it to compare how you run campaigns today with how we would run them.
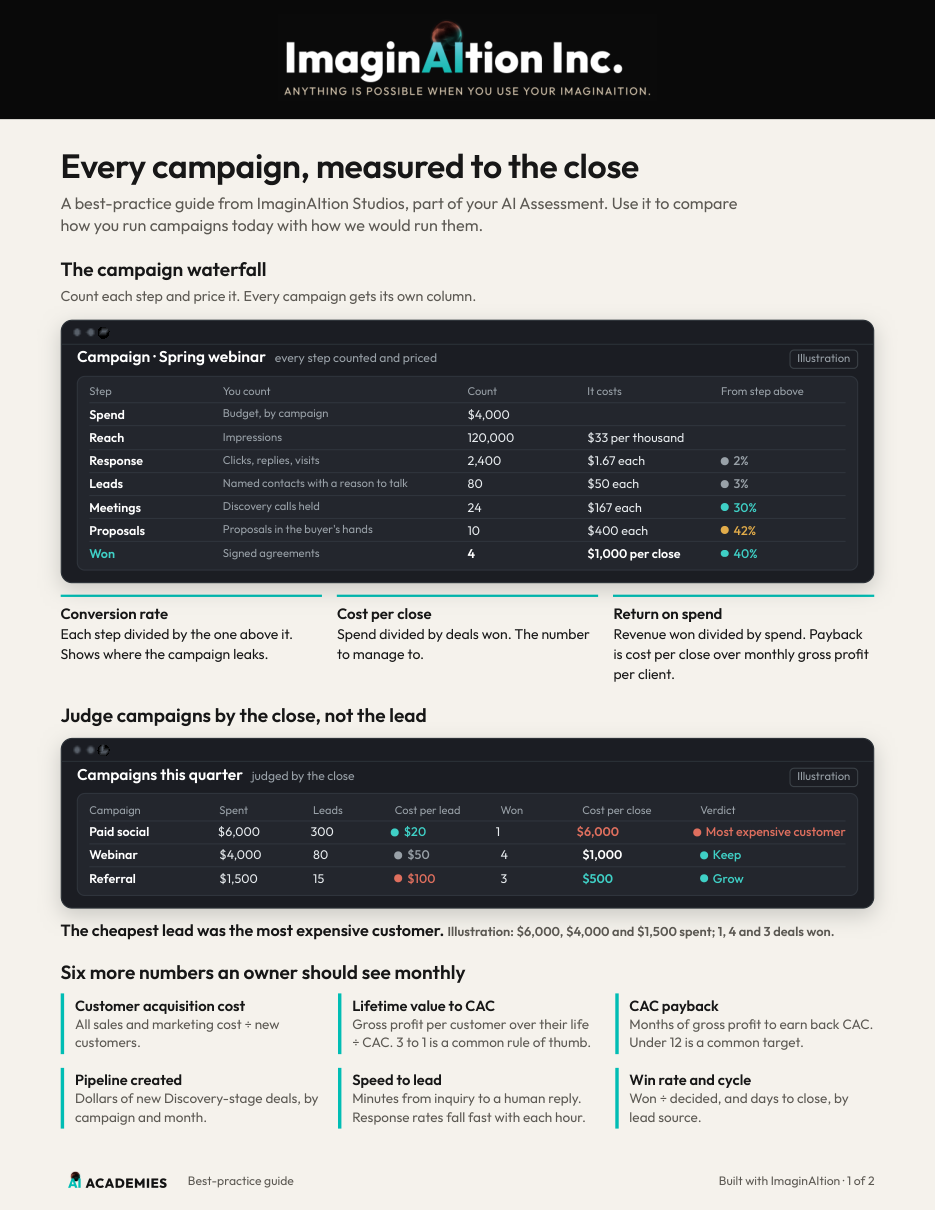
The campaign waterfall
Count each step and price it. Every campaign gets its own column.
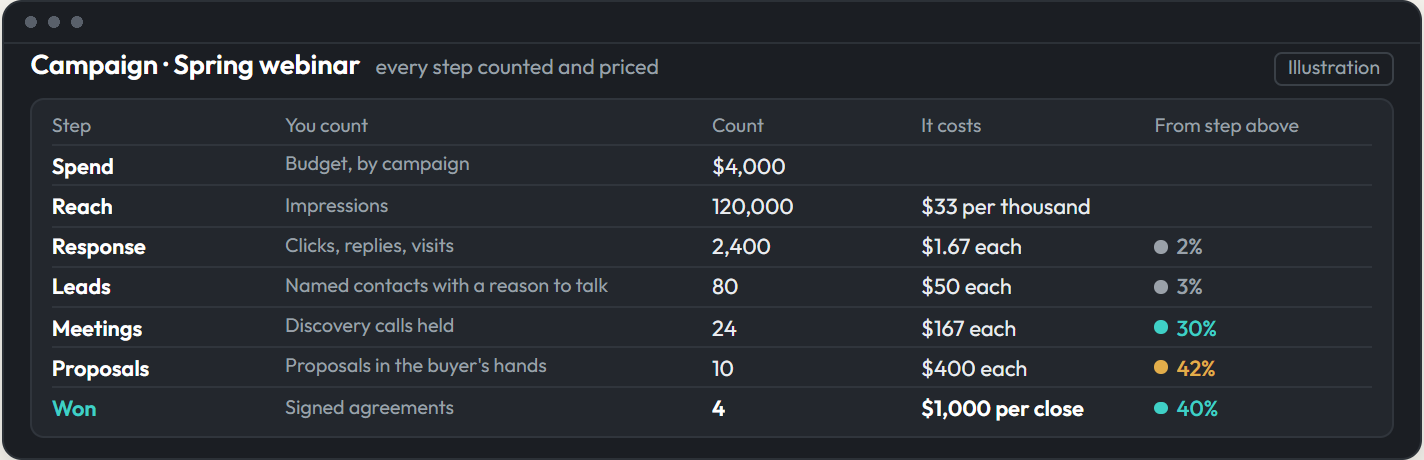
Conversion rateEach step divided by the one above it. Shows where the campaign leaks.
Cost per closeSpend divided by deals won. The number to manage to.
Return on spendRevenue won divided by spend. Payback is cost per close over monthly gross profit per client.
Judge campaigns by the close, not the lead
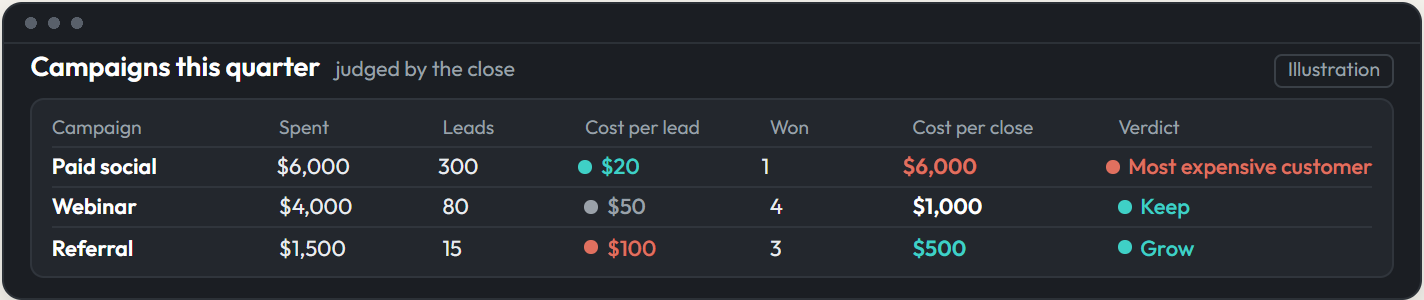
The cheapest lead was the most expensive customer. Illustration: $6,000, $4,000 and $1,500 spent; 1, 4 and 3 deals won.
Six more numbers an owner should see monthly
Customer acquisition costAll sales and marketing cost ÷ new customers.
Lifetime value to CACGross profit per customer over their life ÷ CAC. 3 to 1 is a common rule of thumb.
CAC paybackMonths of gross profit to earn back CAC. Under 12 is a common target.
Pipeline createdDollars of new Discovery-stage deals, by campaign and month.
Speed to leadMinutes from inquiry to a human reply. Response rates fall fast with each hour.Source: Harvard Business Review, The Short Life of Online Sales Leads (2011) Win rate and cycleWon ÷ decided, and days to close, by lead source.
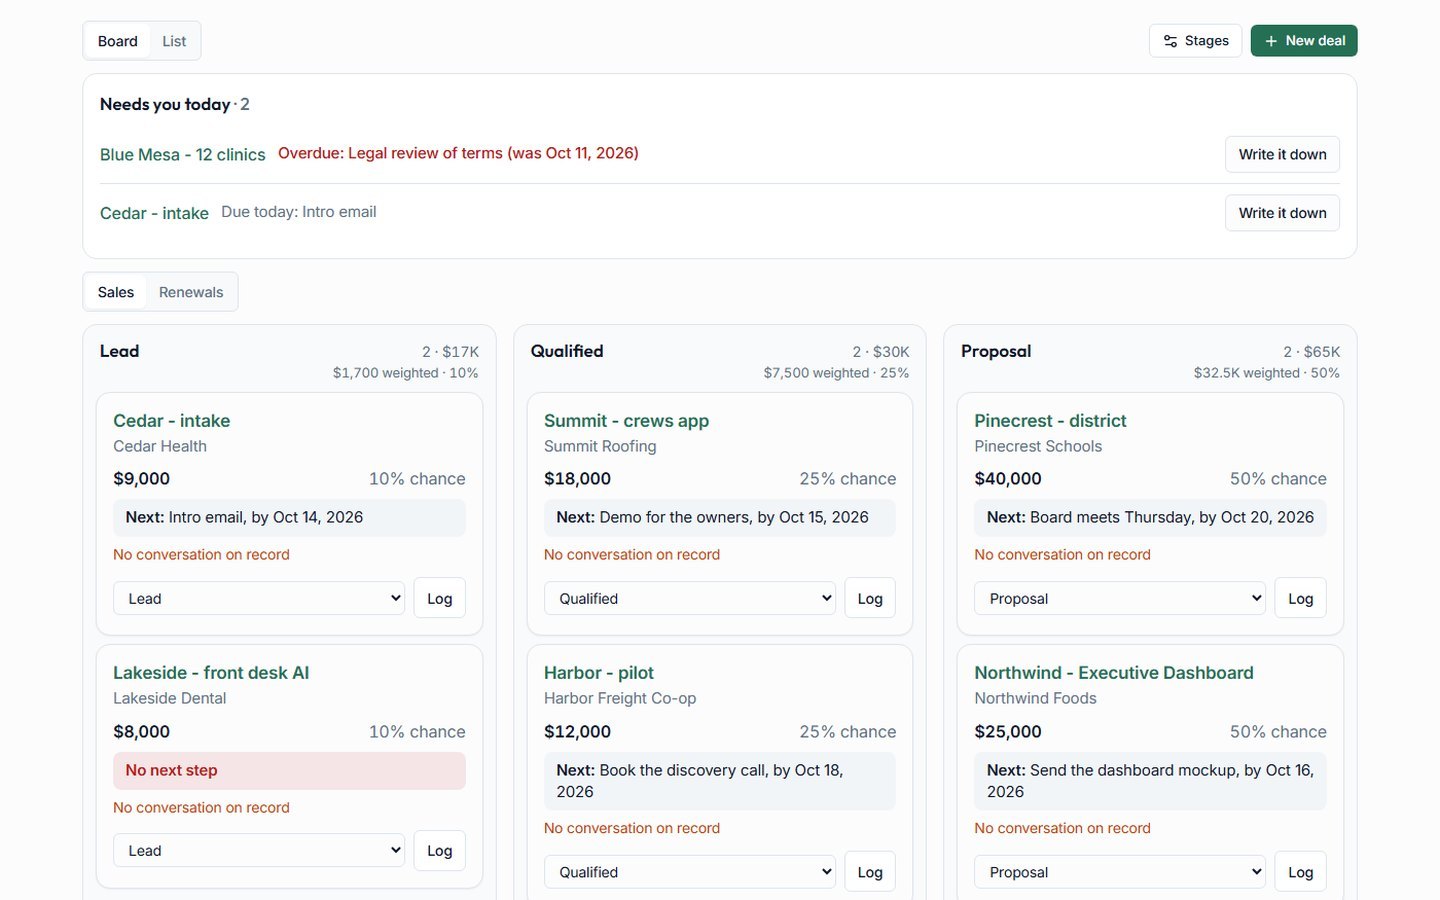
Pipeline stages that mean something
Each stage has a gate you can check. Up to Proposal, evidence moves a deal. After that, judgment does, inside firm rules.
Evidence gates a fact moves the deal
Judgment, with rules your read of the buyer
- Potential0%
Gets in whenAn interested conversation with a real person.
Hard actionAutomated follow-up until a discovery call is booked.
Why 0%More deals in view to learn from, none inflating the forecast.
- Discovery25%
Gets in whenA discovery call is held and a next step is agreed.
Hard actionMore discovery calls as needed to scope the proposal.
- Proposal50%
Gets in whenThe proposal is in the buyer's hands.
Hard actionA review meeting is on the calendar.
- Upside75%
Gets in whenYou believe it closes, and budget and the decision process are known.
RuleAn update from the buyer every 14 days, or it drops back.
- Commit90%
Gets in whenThe buyer confirms the decision date and how they sign.
RuleAn update every 7 days. A slipped date moves it back to Upside.
Closed won · 100%Signed agreement. Hand off to delivery the same day.
Closed lost · 0%Closes with one of the loss reasons below.
On holdThe buyer paused it. Needs a restart date; stays out of the forecast.
Why deals are lost
- No decisionThey kept doing what they do today.
- Went with a competitorName the competitor.
- Budget or priceNo money, or not this much.
- TimingRight fit, wrong quarter.
- Built it themselvesAn internal team took it on.
- Went darkNo reply after repeated follow-up.
- Not a fitWe should not have pursued it.
- No reason, no closeOne reason per loss, tracked by campaign, stage and rep.
From starting points to real probabilities
The percentages above are starting points. Our probability engine replaces them with your own odds as deals are decided.
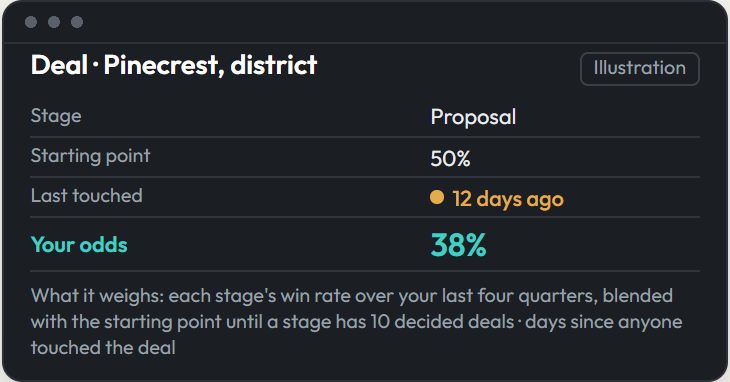
It runs your quarter 2,000 times and shows the range you will land in, weighted by stage and by industry. A deal that goes quiet loses odds, so risk shows before the quarter ends.