Per-door economics
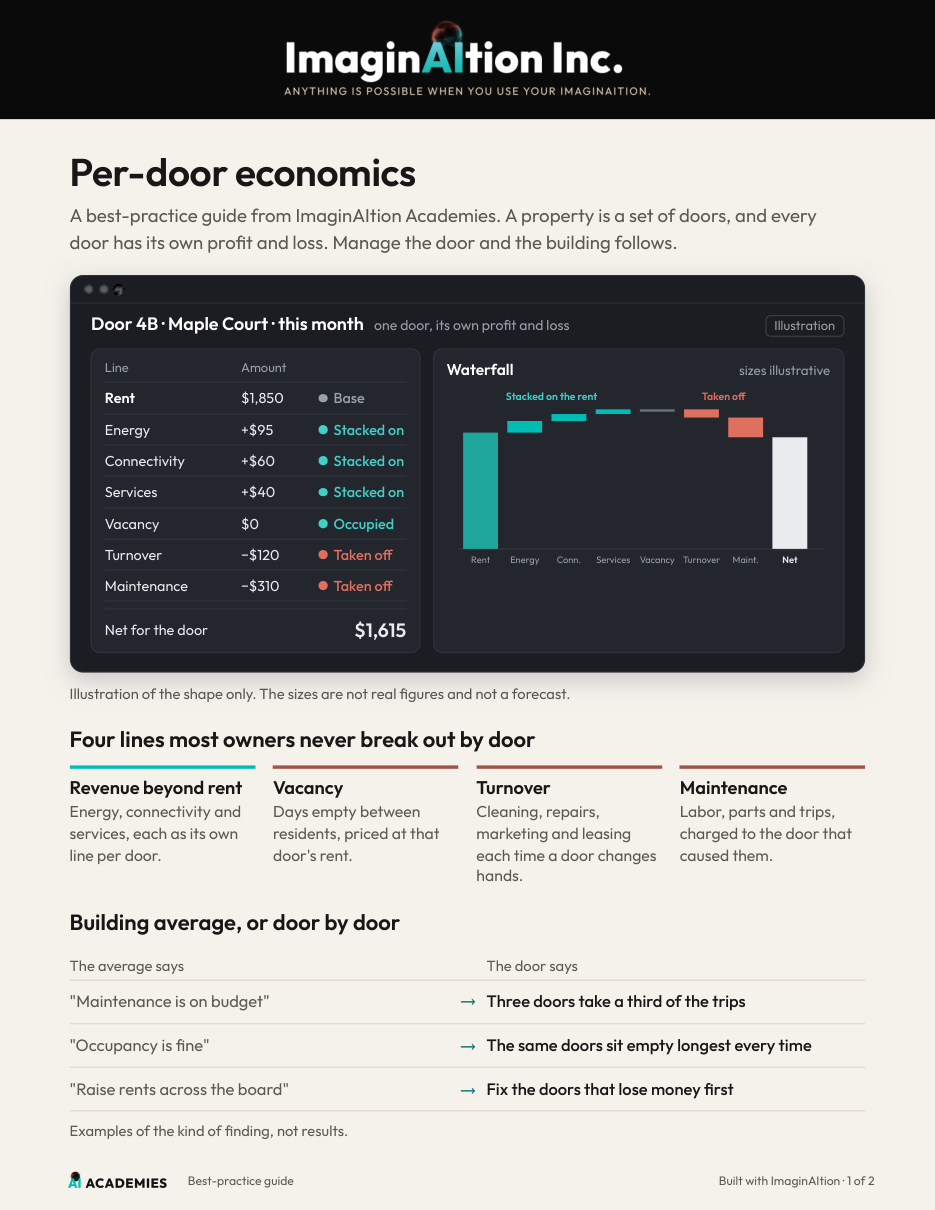
A best-practice guide from ImaginAItion Academies. A property is a set of doors, and every door has its own profit and loss. Manage the door and the building follows.
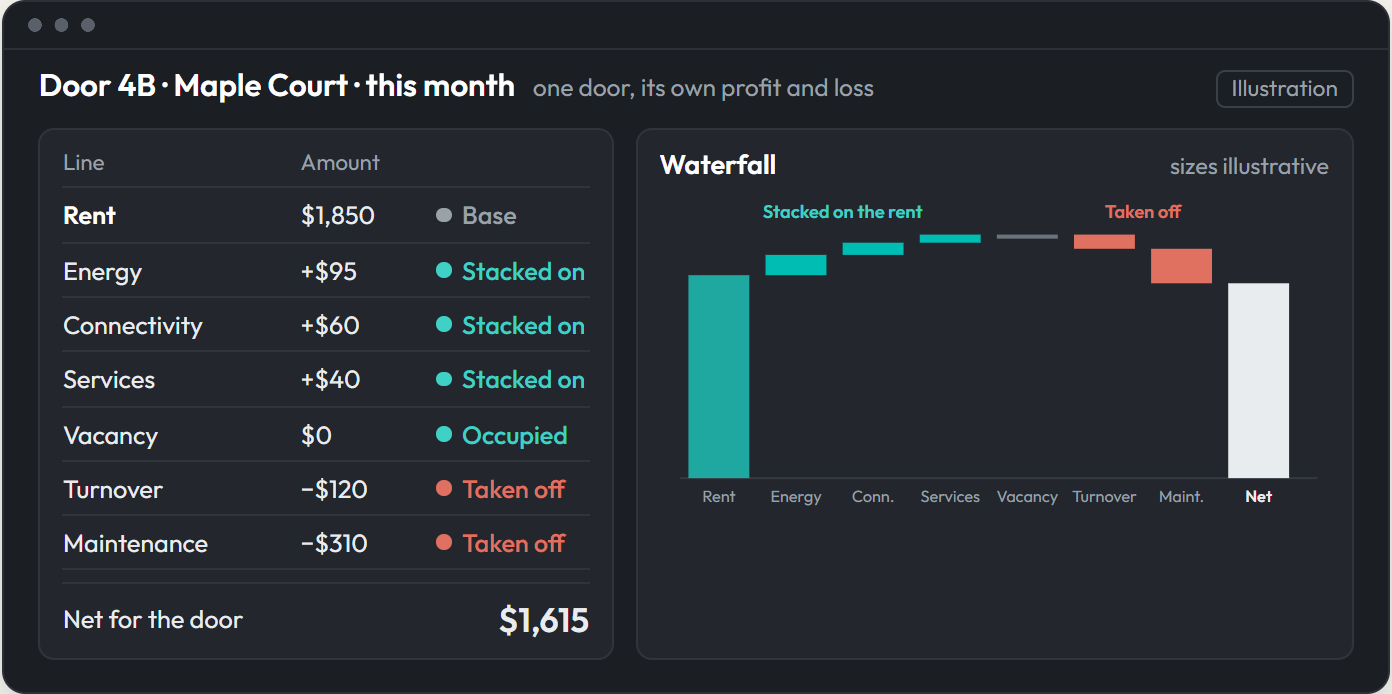
Illustration of the shape only. The sizes are not real figures and not a forecast.
Four lines most owners never break out by door
Revenue beyond rentEnergy, connectivity and services, each as its own line per door.
VacancyDays empty between residents, priced at that door's rent.
TurnoverCleaning, repairs, marketing and leasing each time a door changes hands.
MaintenanceLabor, parts and trips, charged to the door that caused them.
Building average, or door by door
| The average says | | The door says |
|---|
| "Maintenance is on budget" | → | Three doors take a third of the trips |
| "Occupancy is fine" | → | The same doors sit empty longest every time |
| "Raise rents across the board" | → | Fix the doors that lose money first |
Examples of the kind of finding, not results.
The property as one operating system
Maintenance, access, energy and the resident usually live in four systems. Per-door economics needs them in one view.
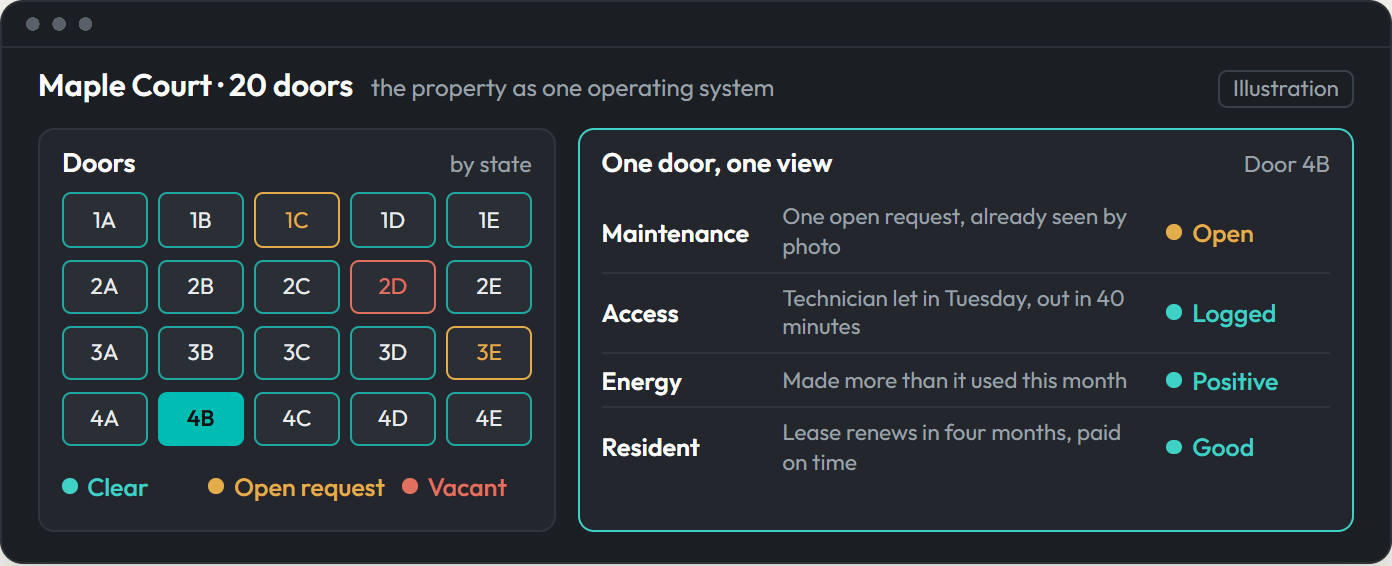
What each part adds to the door's numbers
MaintenanceLook first, send once. Every trip is charged to its door.
AccessLet the right person in without a second appointment.
EnergyWhat the door makes and uses, as its own line.
ResidentLease, payments and messages beside the costs they explain.
Six numbers per door
Net income per doorEverything in, less everything charged to it.
Revenue beyond rentEnergy, connectivity and services as a share of the door's total.
Maintenance per doorCost and trips, ranked. The top ten doors are the agenda.
Days vacant per turnMove-out to move-in, by door.
Cost per turnEverything spent to make the door ready and lease it again.
Renewal rateLeases renewed ÷ leases that came due.
About this guide it teaches the method. cAInopy is ImaginAItion Properties' offer for running a portfolio door by door. Ask us where it stands for a portfolio like yours.